Week Ending August 7, 2009 Total Number of Homes For Sale in the Des Moines Area – 5139 New Listings Taken During the Last 7 Days – 272 Accepted Offers (Pendings) During the Last 7 Days – 176 Homes Closed (Solds) During the Last 7 Days – 133 Average Sale Price of Solds – $155,375 […]
Tag Archives: Des Moines MLS Statistics
Des Moines Real Estate Statistics Week Ending 7-31-09
MLS Statistics HOT OFF THE PRESS! It’s the end of another month!! What price ranges are selling? It’s pretty obvious from this months statistics that the $8,000 economic stimulus is still affecting the under $200,000 price range. The red bar represents homes that are currently for sale (Active Listings). By far the most selection of […]
Des Moines Real Estate Statistics Week Ending 7-24-09
What’s in a name? Obviously – Money
It was announced recently that the Sears Tower in Chicago has been named The Willis Tower after Willis Group Holdings, a London based financial services firm. I don’t care what they officially call it, it will always be the Sears Tower to me. I started thinking about other buildings and landmarks that have lost their […]
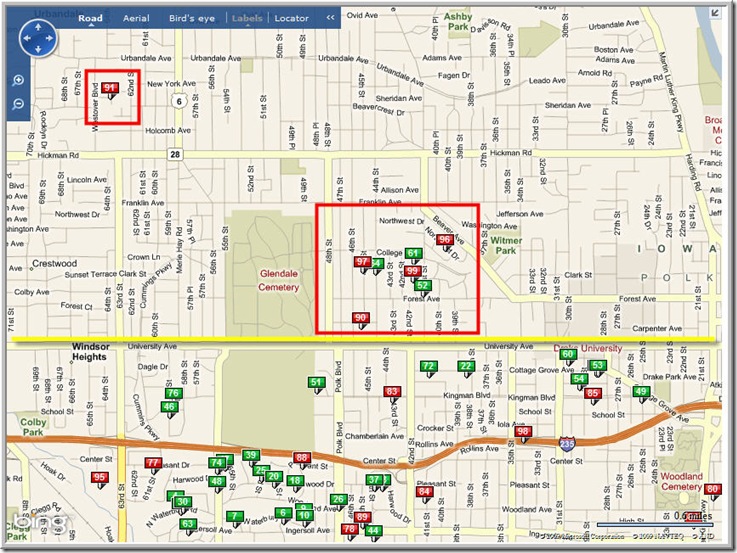
MLS Map Placement – Are Your Listings Being Found? Wanna Bet?
Des Moines Real Estate Statistics Week Ending 7-10-09
Week Ending July 10, 2009 2009 is officially half over and this week I have a lot of statistics to share. So let’s get started! Active Listing Inventory The number of homes for sale have increased every single month since January of this year. Note that it was April of 2008 when listing inventory began […]
Des Moines Real Estate Statistics Week Ending 6-19-09
Des Moines Real Estate Statistics Week Ending 6-5-09
Des Moines Real Estate Statistics Week Ending 5-8-09
Week Ending May 8, 2009 Gray’s Lake Walking Trail… I mean… Unicycling Trail. This past week the number homes for sale continued to increase. Although we are still below last years listing inventory, new listings continue to come on the market. Total Number of Homes For Sale in the Des Moines Area – 5,052 New […]


